Better ways to measure National Income
By
Gross domestic product’s (GDP) size, its growth rate and per capita conversion by population (per capita income) are some of the most widely used indicators to measure the economic health of any country. National Accounts (NA) division of the national statistical bureau is responsible for measuring GDP – on annual or quarterly basis. United Nation in collaboration with major multilateral agencies (i.e. World Bank, International Monetary Fund, Organization for Economic Co-operation and Development, European Commission) has provided detailed guidelines to measure GDP for accuracy as well as comparability across nations. These guidelines are collated into a volume known as the System of National Accounts (SNA). Latest version of SNA is for 2008 . Among others, SNA 2008 advocated to adopt Supply and Use Table (SUT) for consistent measurement of GDP. There are three ways of measuring the GDP of a country. These are by (i) product method; (ii) income method and (iii) expenditure method. The use to SUT will automatically provide three measures of GDP ensuring their internal consistently. Adoption of SUT will also reveal inconsistencies in supply side and the use side and thereby point to areas for improvement. In addition to SUT, revision and rebasing of GDP are also needed to improved accuracy and coverage. This note argues that Bangladesh Bureau of Statistics (BBS) should adopt SUT in its entirety along with timely revision and rebasing for a better measurement of GDP.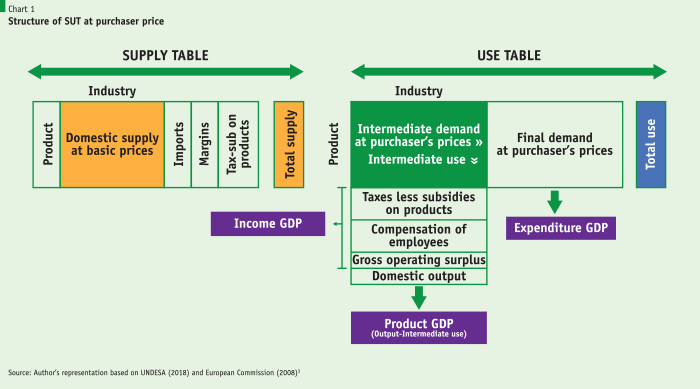
Supply and Use Table (SUT)
According to UNDESA (2018) , the SUTs are an integral part of the SNA 2008 forming the main framework for the compilation of a single and coherent estimate of GDP integrating all the components of production, income and expenditure approaches as well as providing key links to other parts of the SNA framework. Other features of the SUTs are provided below.
• The SUTs show how products (goods and services) are brought into an economy (either through domestic production or imports) and recorded in the Supply Table. The use of these same products as intermediate consumption, final consumption by institutions (e.g. household, non-profit institutions serving households, general government), gross capital formation and exports are recorded in the Use Table.
• The SUTs also provide the link between components of Gross Value Added (GVA), industry inputs and industry outputs. SUTs can also be formulated to show the role of different institutional sectors (for example, non-financial corporations, government, etc.) providing an important mechanism to link to the different accounts of the SNA framework (the goods and services account, production account, generation of income account and the capital account).
• The SUTs are also an important analytical resource in their own right, showing the interaction between producers and consumers. They are also important basis for generating Input-Output Table (IOT).
• SUTs and IOTs have received much attention in recent years due to their analytical properties allow for a much wider set of analyses not only of the national economy and the regions within a nation but also of the inter-linkages of economies at global level as well as environmental impacts. The SUTs and IOTs are compiled by many countries as part of their ‘core’ National Accounts production thereby improving the coherency and consistency of their National Accounts’ estimates.
• The structure of SUT and the estimation of GDP by three methods has been captured in the Chart 1 below.
Adoption of SUT although certainly improve GDP estimation, revision and rebasing of GDP at reasonable intervals are also strongly recommended for accuracy, structural changes and comparability.
GDP Revision
The accuracy of national accounts estimates and their comparability across countries depend on timely revisions to data on GDP and its components. The frequency of revisions to GDP data varies. Some countries revise numbers monthly, others quarterly or annually, and others less frequently. Such revisions are usually small and based on additional information received during the year. However, in some cases larger revisions are required because of new methodologies and changes to the base year. The new base year should represent normal operation of the economy—it should be a year without major shocks or distortions.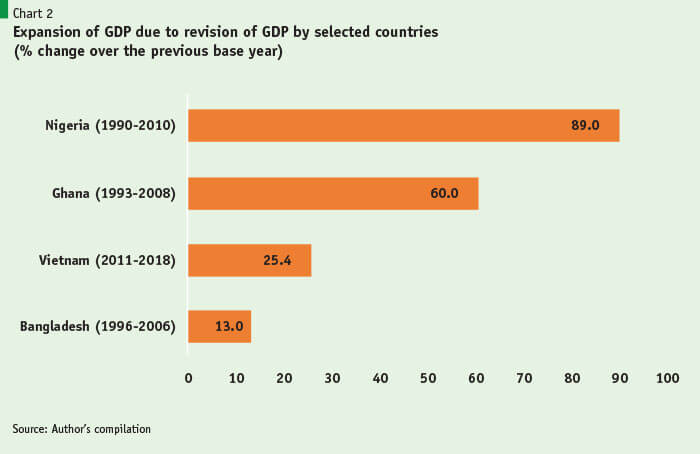
Comprehensive revisions of GDP data usually result in upward adjustments as improved data sources increase the coverage of the economy and as new weights for growing industries more accurately reflect their contributions to the economy (Chart 2). These revisions may cause breaks in series unless they are applied consistently to historical data. For constant price series a break caused by rebasing can be eliminated by linking the old series to the new using historical growth rates. But for nominal GDP data a break in the time series cannot be avoided unless the statistics office revises historical series. Other series affected by the break in GDP are fiscal indicators expressed as a percentage of GDP. When nominal GDP is revised upward, the ratio of revenue and expenditure to GDP look smaller than previously reported. For more on GDP revision please see World Bank.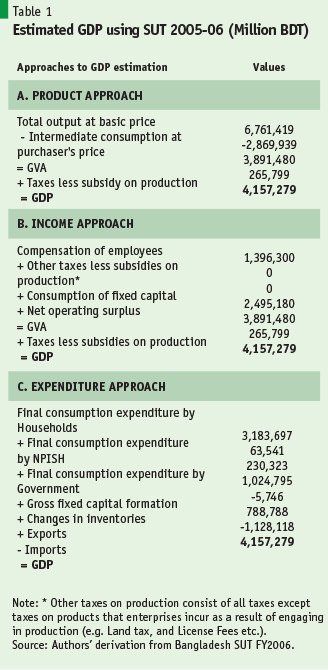
GDP Rebasing 6
Along with GDP expressed in constant prices, GDP data are also expressed at current prices, i.e., prices of the prevailing accounting period which is also known as nominal GDP. Changes in nominal GDP over time arise from two effects – (i) Price effect (inflation); and (ii) Volume effect (quantity of goods and services). However, Proper assessment of economic growth requires removal of price effect. This is accomplished by calculating GDP for each year at the prices of a particular year (base year). Base year is the year to which the weights relate in the construction of a volume or price index. GDP measures with the price effect removed are known as volume measures of GDP (or real GDP or GDP in constant prices). Changes in volume measures of GDP are referred to as real GDP growth. Volume measures of GDP or real GDP are usually obtained through price deflation. Prices used to calculate volume measures of GDP need to be frequently updated. The process of replacing present price structure (base year) to compile volume measures of GDP with a new or more recent base year is known as rebasing. It composed of changing price and quantity base for individual price and quantity relatives. Moreover, it involves updating weights used in aggregating individual quantity relatives into sub-indexes and aggregating these sub-indexes into more aggregated indexes (for example, GDP).
Rebasing of GDP is needed due to continually changing economic environment. In the production side these include (i) overtime changes in the production patterns; (ii) continuous developments and innovations; and (iii) and obsoleteness of many products. Similarly, in the demand side these are related to (i) the structural changes in consumption patterns; (ii) the structural changes in acquisition of capital goods; and (iii) changes in openness of economy to rest of the world. All these changes in the components of the production and demand sides imply relative prices change over time. Price structure becomes less representative of base year structure as time progresses. Products with relatively higher volume growth tend to have relatively weaker price increases – substitution effect. But they tend to comprise larger share of GDP at present base year (prices of distant past). Volume measures of GDP will become misstated because of substitution bias. This is less useful for economic analysis. Thus, there is need to update base year to more recent one to ensure weights used to calculate volume measures of GDP are more representative of economic reality and also to correct substitution bias.
…there is need to update base year to more recent one to ensure weights used to calculate volume measures of GDP are more representative of economic reality and also to correct substitution bias.
Bangladesh SUT and GDP revision-rebasing
With the assistance of the Asian Development Bank (ADB), BBS compiled first and only SUT for Bangladesh for FY 2005-06. The Bangladesh SUT consists of 32 Industry classifications and 51 Product classification and was values at purchaser’s price. Using the SUT data, GDP by three methods has been estimated. As expected, consistent GDP values have been emerged from this exercise. The estimation of GDP by three methods using Bangladesh SUT 2005-06 is presented below.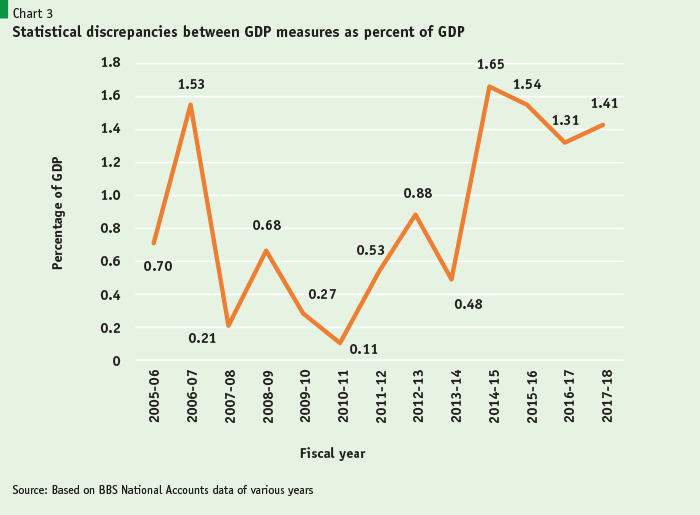
Estimation of GDP by three approaches using the Bangladesh SUT reveals that whatever approach is adopted GDP value should be same. It also suggests that there no scope of statistical discrepancies between these measures. Large statistical discrepancies between GDP by these three types cast doubt over the GDP measurements.
Compilation of SUT and subsequent balancing of SUT elements (i.e. industries and products) compel the national account compilers to look for better data or information.
GDP estimations using Bangladesh SUT indeed confirm these features. The estimated value of GDP in Bangladesh in 2005-06 was BDT 4,157,279 million. Re-assuring outcome of this exercise is that use of SUT will force the national account compilers to produce better data, eliminate statistical discrepancies and better estimation of GDP. BBS no longer produces SUT.
The estimated value of GDP in Bangladesh in 2005-06 was BDT 4,157,279 million. Re-assuring outcome of this exercise is that use of SUT will force the national account compilers to produce better data, eliminate statistical discrepancies and better estimation of GDP.
Statistical discrepancies between expenditure method and other method of GDP used by BBS (a combination of production and income methods) has been large and widening.
Statistical discrepancies as percent of GDP have been less than 1 % between FY 2009 and FY 2014. But ratio has been over 1 % during the recent years due to a number of factors – dated weights and coefficients; lack of revision of coverage; and unaccounted price variations.
Recommendation:
1. BBS should resume compilation SUTs on an annual basis by fiscal year 2022 until the GDP estimations are conducted on a quarterly basis. This move may require strengthening capacity of the National Accounts Division of the BBS. BBS should also set a target time frame by which Bangladesh start producing quarterly SUTs and quarterly GDP (a desirable time frame would be 2025).
2. Revision and rebasing are important components for producing accurate state of the economic structure as well as size. Given Bangladesh’s resource constraints, GDP revision and rebasing should be conducted by every five-year time interval. This will require conducting several new surveys to capture emerging activities as well as to update the old structures of existing activities.