Catching up with development
By
Growth winners
A fundamental question that underlies the issue of economic growth is whether less developed countries are indeed catching up with the rich ones. If the traditional Solow model were right, convergence would come around at some point over the so-called ‘long run’. More recent contributions to the subject matter point out some ‘endogenous’ factors that may break that convergence, as the cases of innovation (Romer 1990) and institutional development (North 1994), among others. While most empirical literature supports these hypotheses, real stylised facts are rarely used to draw conclusions on the extent to which this catching up process is leading to a more equitable world. By using data from the World Bank, some comparative charts are presented to explore the above question. This data shows the GDP per head at two points over time, which are 1990 and 2017. While said comparison hides numerous crises and periods of world economic expansion, it unveils a number of interesting specific-country facts that might be properly considered.
This data shows the GDP per head at two points over time, which are 1990 and 2017. While said comparison hides numerous crises and periods of world economic expansion, it unveils a number of interesting specific-country facts that might be properly considered.
As shown in Chart 1, our comparison can be made by dividing countries into four groups. In quadrant I (southwest), we plot countries below a GDP per head of $60,000 in both years. While most of them exhibit a higher GDP per head in 2017 relative to 1990, there is a wide variety of cases. Some countries experienced major jumps. Some others, though, appear to have had rather modest progresses. The second quadrant (northwest) gathers genuine winners, as they managed to cross the $60,000 line between 1990 and 2017. In some cases, they managed to more than double their GDP per head (China Macao and Singapore). A case worth looking at is Ireland. It is the only European country that timed its GDP per head by more than three over this time span. While the explanation probably lies in various factors, two clear facts can be mentioned. One is the access to the European market since Ireland´s integration into the European Union, which significantly triggered the country´s exports. The other one hinges upon the low weight of taxes relative to countries with a similar development. Among OECD countries, Ireland exhibits a rate of tax revenues to GDP of 23.3% (2016), which is substantially lower than the OECD average (34%). Although the story of Asian new economic leaders differs from Ireland’s in a fundamental way, it is similar to it regarding their rapid and aggressive economic integration with the world and their attempt to create a market friendly environment. 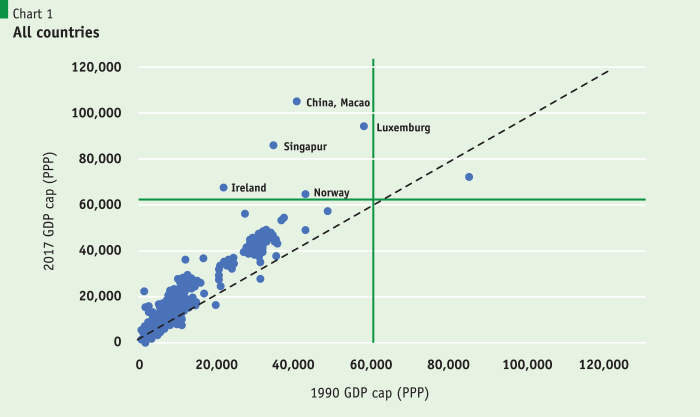
We will abandon quadrants three (Northeast) and four (Southeast) for them being relatively empty, and proceed with a close up of quadrant one (Southeast), in which most countries are located in. Then again, we can see our four quadrats division among countries below $60,000 of income per head (Chart 2). Let alone the cases of China and Hong Kong, South Korea and Malta appear to be clear winners. In both cases, they managed to more than double their GDP per head. They are similar to each other in having no significant natural resources of their own. Nonetheless, they both accomplished a successful process of economic integration that boosted exports. As opposed to Malta, in which this occurred in the wake of its integration to the European Union (2004), South Korea was subject to a deliberate export oriented state-led policy that put a strong emphasis on manufactures. Nonetheless, this policy took the form of an ample state intervention over the 1970s and 1980s, which is not feasible nowadays. The role played by the WTO as well as the world’s rapid economic globalisation make it difficult for existing developing countries to enter the international economic landscape without having to agree upon rules that view explicit state support to exports as not acceptable.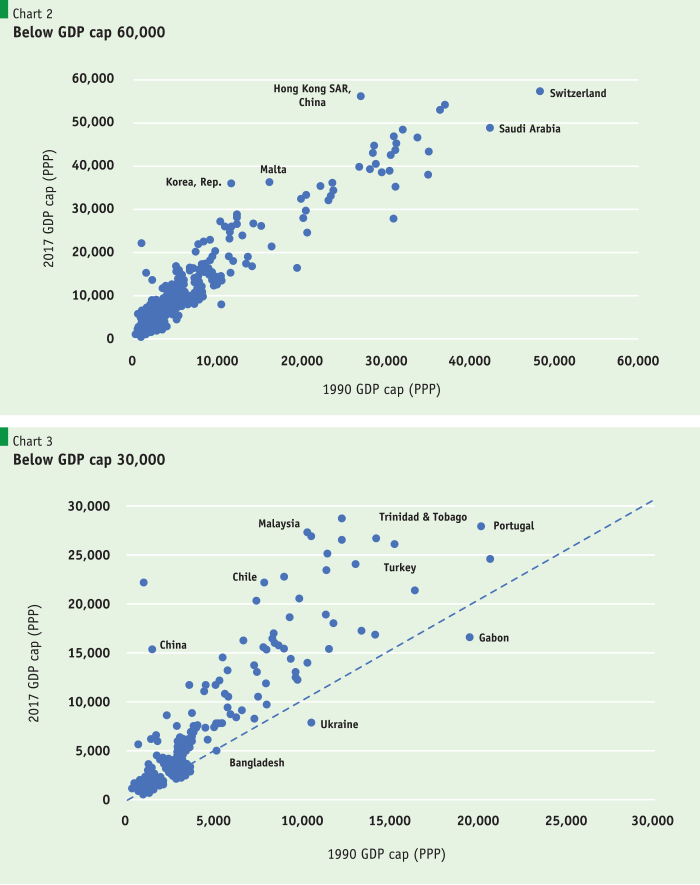
A deeper look into quadrant one from Chart 2 presents us a more detailed picture of countries below $30,000 GDP per head (Chart 3). Winners are those clearly above the 450 line. Among them, three separate stories can be told. One is that about better market opportunities due to access to new extended markets. This is likely to be the case of Portugal in the context of the European Union and China because of its successful export-led economic growth. The second story stresses the role of explicit government policies intended to promote growth even beyond the sole benefit of new extended markets and/or abundant natural resources. While all cases being pointed out host some ingredients of this, Malaysia is probably a case in point as it combines aggressive pro-development government policies over the 1970s and 1980s with rich reserves of oil and gas. Explicit government action might be observed in Chile also. In this case though, said ‘action’ was geared to strengthening property rights, keeping fiscal balance and low inflation and promoting private savings and investment, among other goals. The country passed from having the seventh highest GDP per head in Latin America by the early 1970s, to having the highest one by the late 2010s. The third story is about the role of natural resources. While this can be made into a blessing when complemented with sound local economic policies (e.g. Trinidad & Tobago), the recent economic collapse of Venezuela is a clear reminder that having abundant oil reserves is not enough to become a rich country.
… factors that trigger economic success are usually a combination of better access to extended markets complemented with sound local economic policies.
Three lessons can be drawn from the cases above. One, less developed countries can indeed experience significant changes in a relatively short period. Two, factors that trigger economic success are usually a combination of better access to extended markets complemented with sound local economic policies. Three, having abundant natural resources may help, but it is not enough condition. Venezuela used to be the forerunner among Latin American countries. Now it is number seven and its economy is shrinking.
Convergence
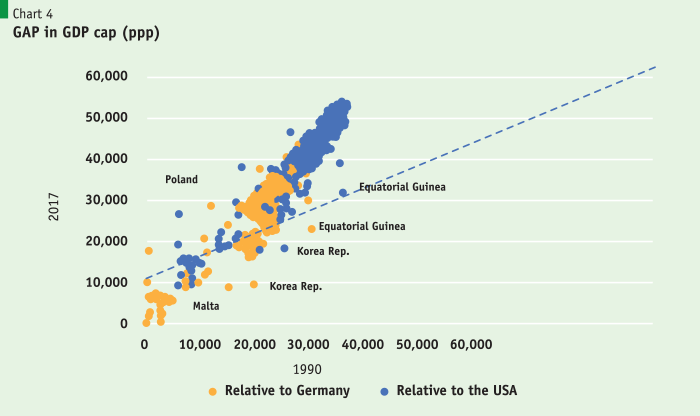
Turning back to our ‘convergence’ question, we may explore the answer by measuring the gap between the GDP per head in specific countries and a pre-defined benchmark. In our case, two alternative benchmarks will be used- per capita GDP of USA and per capita GDP of Germany. By comparing the gap between them in 1990 and 2017, we may speculate as to whether a trend to convergence does exist and if it does, which countries managed to get closer to our standard over this period. Chart 4 shows the plots based on both standards. While the blue dots represent the gap relative to the USA, the orange plots depict the ones relative to Germany. In order to focus our analysis on less developed and developing countries, cases reported in Chart 4 are those for which the gap – both in 1990 as well as in 2017, is positive.
At first glance, we observe that at least in the period under analysis (1990-2017), convergence does not appear to be a dominant trend. Since dots are mostly above the 450 line, it follows that the gap (in most cases) is larger in 2017 than it used to be in 1990. While various good performing cases lie barely below the 450 line, just a few cases clearly register a lower gap by the end of the period. Once again, South Korea and Malta stand as dominant cases. Interestingly, Equatorial Guinea arises as an outperforming case. This has been a case of successful use of abundant oil and gas reserves, pushing the country to the top of the African region. While low inflation and controlled budget deficit have been the rule over recent years, corruption and low GDP diversification appear to be significant challenges for the years to come. Data from 2018 and some forecasts for the 2019 is reflective of a contraction in this country´s GDP. 
Our data raises the question why relatively poor countries appear to drift apart from the ‘rich’ ones in the chart. One feasible explanation is that our comparison is no good. The USA has been going through a continued economic expansion for at least 11 years in a row, which might turn it into a bad standard to compare with. A similar argument might be made about Germany, which happens to be the largest EU economy and it has recorded a significant expansion following the 2008 crisis. Developing countries are usually more unstable as far as growth is concerned, this being particularly noticeable over short periods. This leads to the following feasible explanation. When we talk about convergence, we implicitly assume that this is a ‘long term’ phenomenon. Economics does not specify how many years might take for a low-income economy to fully catch up with high-income ones. It only says that this will occur when some type of equilibrium is achieved. Needless to say, that equilibrium is very unlikely to be achieved yet. There is still the chance that on average, developing countries are indeed unable to catch up. If this is true, the big question is why this is so.
There is still the chance that on average, developing countries are indeed unable to catch up. If this is true, the big question is why this is so.
An inquiry into the economic forces that most likely will shape the short and the long run world growth over the coming years suggests that globalisation is certainly one of them. Regardless of the political attempt of the USA to isolate itself from migration and recover some lost autonomy in deciding about tariffs and trade policies, and/or the threat of Brexit in Europe and elsewhere, the world is likely to become even more economically integrated in the ‘long term’. Technology itself is playing a major role in this regard, by lowering transaction costs, making airfares cheaper over time and promoting labour mobility between countries. Will some isolated political efforts will be able to stop that? The answer is certainly negative.
As in all stories, there might be rainy days in the years to come. A slowdown in the USA and even a recession is likely to come. China and the Eurozone are likely to follow through. The fact that rapid progress in economic performance is indeed observed in some selective countries should invite us to consider that convergence is actually feasible. However, this requires sound local economic policies. Some important ones are: i) macroeconomic stability, which includes fiscal balance and low inflation, ii) a well-designed tax structure which promotes private saving and make local and foreign investment attractive, iii) good support for the poor in the areas of education, health, housing and pension schemes and iv) a general market friendly environment that takes proper advantage from the opportunities of international trade and globalisation.
References
North Douglass C., (1994). “Institutions Matter,” Economic History 9411004, University Library of Munich, Germany.
Romer, Paul M, (1990) “Endogenous Technological Change,” Journal of Political Economy, University of Chicago Press, vol. 98(5), pages 71-102, October.