Who has benefitted from growth?
By
During the current decade Bangladesh has grown on average at about 6.6% per annum. In the last three years growth has accelerated to above 7% and almost reached 8% last year. This performance makes Bangladesh one of the fastest growing economies in the world. Yet there are two main concerns about these rapid growth rates. The first is regarding the validity of the growth numbers themselves and the second one is about the beneficiaries of this rapid growth.
As economists we also share these concerns. Take, for instance, the growth rate of 7.9% economic growth rate of last year that was based on an estimated, sizzling 14% growth by large and medium manufacturing enterprises. Industrialists and statisticians both express skepticism about such claims for the large-scale manufacturing sector. Then there are other indicators also that are inconsistent with this high growth rate. Chief among these are: the virtually static private investment rates; the startling decline in broad money supply relative to GDP last year and in the first half of FY2019; and the extremely low rate of revenue collection in the current fiscal year despite robust manufacturing growth. Financial indicators—which are harder numbers and more reliable—are not moving in line with the officially recorded growth in GDP.
Despite these issues, few will contest that Bangladesh is a rapidly growing economy. For instance, even if one were to think that actual large-scale manufacturing growth rate was half of what has been claimed, the overall GDP growth would still be close to 7%. Similarly, while private investment rates have been stagnant, the overall investment level of about 31% of GDP is respectable because of the boost in public investment in recent years. Growth rates of over 7% may be achievable with these investment rates – assuming implementation of public investment is effective – for at least the short to medium term.
This brings us to the second concern: how growth is being distributed and to what extent are people benefiting from this growth? As some commentators have pointed out, the income disparity between the top and bottom rungs of income earners have sharply widened. One important commentator has estimated that contrary to normal expectations most household incomes are not growing in real terms.
…the income disparity between the top and bottom rungs of income earners have sharply widened.
One way to cross check growth outcomes in national income estimates is to look at the household survey data results based on the Household Income and Expenditure Surveys (HIES) and the Labor Force Surveys (LFS). These surveys have their own problems. As in many other countries – including neighboring India – the incomes and consumption estimated from household surveys in Bangladesh are well below the national income accounts – by about 60% for incomes and 50% for consumption. This underreporting is particularly acute for income: one indicator of this problem is that income reported by many households in HIES is significantly below the consumption expenditures reported by the same household. Expenditure or consumption for the poorest 10% of households could be about three times their reported incomes. Interestingly, the discrepancy decreases as households become richer. For the richest 20% of households, expenditures are lower than their incomes.
These anomalies may happen because of sampling problems. It can also happen because household incomes do not reflect corporate profits, retained earnings and investments by firms, public investment and expenditures on goods and supplies, or, importantly in Bangladesh, remittance receipts from foreign workers. For these reasons, economists in many developing countries with weak statistical systems rely on consumption estimates and do not take the household income estimates seriously. Even so, there is a second check on income which comes from the labor force surveys which reports monthly incomes earned by workers. Overall, despite problems, these surveys are used in all developing countries to gauge the welfare of people at the household level.
So, what do these surveys show? Below (Charts 1-4) we present the findings of real per capita income and consumption growth between 2010 and 2016, as well as real growth of monthly earnings of workers workers between 2010 and 2017. The data is presented by deciles – by groups of 10 % of Households – and by the top and bottom 5%. The data for the first two Charts (Charts 1 and 2) comes from HIES, while the data for Chart 3 come from Labor Force surveys. In the case of HIES, the nominal income and consumption for each decile came directly from the HIES report in 2010. In 2016, the nominal incomes and consumption had to be estimated from the raw data and then checked for consistency with the HIES 2016 report on income and consumption distribution. The time periods correspond to the year when the surveys were carried out. All three sets of data used below were converted to 2016 prices (in the case of HIES) and to 2017 prices (in the case of the LFS) to make them comparable in real terms. The price data were differentiated by rural, urban, and national Consumer Price Indices.
The findings support, quite robustly, the picture of a fast-growing Bangladeshi economy, where growth has impacted positively most sections of the population, except for the poorest 10% of households.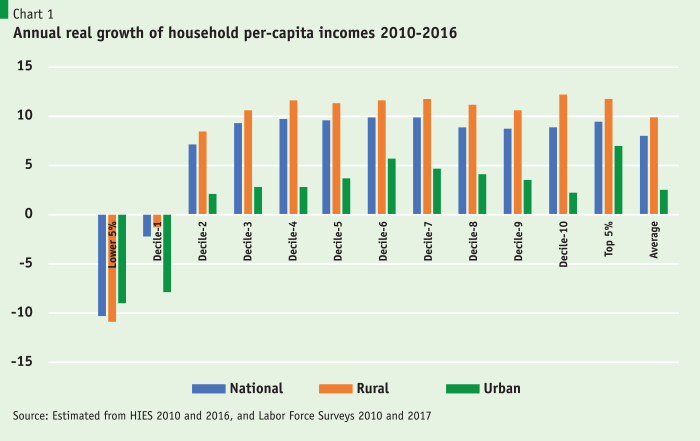
Chart 1 provides annual real growth rates in per capita income based on household income growth in real terms and divided by size of households in the different deciles. On average, per-capita income has grown by 7.4% for the households. Growth has been particularly robust for the middle-class households–comprising roughly 50% of the households from deciles three through seven. Growth has been more robust for rural households than for urban households. This is a theme we will return to again. Finally, the bottom 10% of households and especially the poorest 5% of households have seen their real incomes decline, i.e. the rising tide has not lifted the income of the poorest group. Finally, Chart 4 presents estimates of the Gini coefficient for 2010 and 2016 for both income and consumption. In the case of income, the Gini coefficient has increased from 0.46 to 0.48 driven mostly by the rise of urban inequality where the Gini increased from 0.45 to 0.50.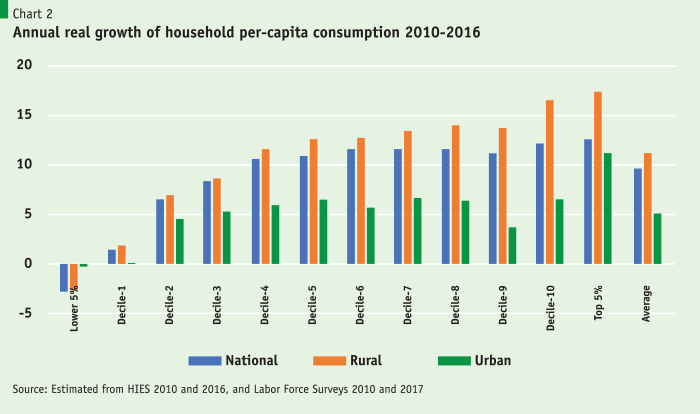
As noted previously, serious problems arise from under estimation of income in these surveys. A far more robust and widely used measure is consumption expenditures by households. The trend in growth in consumption is equally robust as in the case of income. On average, as presented in Chart 2, household consumption per capita has grown at a robust rate of 9% per annum driven by a nearly 13% growth in rural per capita household consumption. The pattern of consumption growth across income groups is more markedly skewed towards the wealthier households. Here too, we find that the bottom 5% of households have lost ground as reflected through a decline in real consumption per capita. And, as in the case of income, rural household consumption growth has been markedly higher than urban households. However, despite the skewness in consumption growth, the consumption Gini coefficient (Chart 4) indicates that at the national level consumption inequality has been relatively stable and low at 0.32. However, this conceals the rise of consumption inequality in rural areas where the Gini has increased from 0.28 to 0.3. In closing this point, we need to acknowledge that Gini coefficients in countries like Bangladesh are likely to be underestimated because both the very rich and the extremely poor tend to be under-sampled in surveys.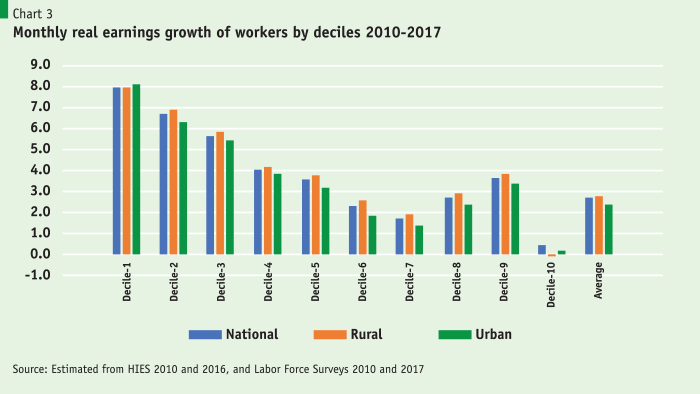
The last piece of evidence comes from increases in real wage as presented in Chart 3, where workers have been grouped by deciles according to their incomes. The result supports the picture of a robust economic growth but is otherwise remarkably different about its distribution than income or consumption growth reported in HIES. Overall average wage growth was moderate, growing by 2.7% per annum between 2010 and 2017. However, in contrast to consumption and income growth estimates form HIES, monthly earnings 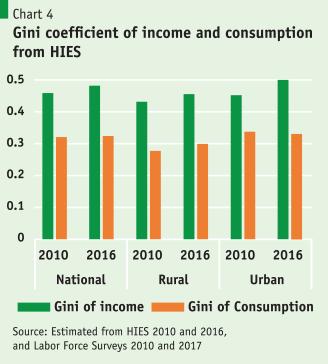 increases have been the fastest for the poorest workers. Rural income growth is higher at 2.8 % while urban income growth is significantly lower at 2.3 %. One important outcome of significantly faster rural wage growth is that urban-rural income differentials for wage workers collapsed in 2017. A last point to note here is that the Labour Force survey of 2013 suggests that both employment and wage growth have markedly slowed since 2013. This accounts for the relatively modest growth in wages that we have found here. However, the 2013 survey is controversial, and the issues highlighted there need a separate discussion that we will not take up here.
The bottom 5% of households or more than 8 million people have seen a decrease in real income and consumption.
So how should we conclude? There are three main takeaways. Household level income, consumption data from HIES and monthly earnings growth from the labor force surveys support the picture of a fast-growing economy in line with the national income accounts. Second, importantly, this rising tide has lifted most boats, but not all boats. The bottom 5% of households or more than 8 million people have seen a decrease in real income and consumption. Third, urban income and earnings growth has distinctly lagged behind growth in rural areas. This suggests both the dynamism of the rural farm and non-farm sector and the rapid pace of urbanization caused by influx/migration of destitute and ultra-poor families to urban centers in search of low-paying jobs. Rural income and consumption per capita have also been benefitted by inflow of remittances from domestic urban areas and foreign countries as a significant proportion of rural young men and women are working in urban centers and in foreign countries.
The exclusion of the bottom rung of households from growth and the lagging behind of urban areas are both serious issues that will need to be addressed.
The exclusion of the bottom rung of households from growth and the lagging behind of urban areas are both serious issues that will need to be addressed. However, keeping this important constraint and data limitations in mind, the data does not suggest any alarming rise in inequality across the board in Bangladesh except at the very top and very bottom end. As of now it is unclear why this has happened, and more surveys would be needed to determine the socio-economic and demographic characteristics of the bottom 5% of the population. In particular, we need to know whether the bottom 5 % of the population are mostly elderly, divorced, and physically and mentally challenged persons or they are mostly members of ultra-poor land less families or climate refugees. Based on these findings, the intervention strategies may be devised with emphasis on both redistribution policies and on how to motivate and regulate the wealthier sections of the population to investing more in Bangladesh to create good jobs especially in manufacturing and high-end services and paying more taxed to support government’s social protection program. Government policies to support a vigorous and more socially equitable urban development (particularly with focus on low-income urban housing, public education, and health facilities) will have to be a key part of this effort.