Dhaka centric-growth: At what cost?
By
Context
Bangladesh was liberated almost 48 years after a devastating war of independence. Thousands of roads, bridges, and culverts had been destroyed in the war. Chittagong port – the only lifeline to the global economy – lay blocked due to mining and sunken ships. Ten million displaced persons who had taken shelter in India were returning to their homes, many of which have been burned and destroyed. Then there was the trauma of the families of millions killed, assaulted, and raped during the war. In that bleak landscape, of 1972, it is no wonder that Bangladesh was hailed “as the test case for development.” If Bangladesh could overcome her challenges and develop, then it would become a model for other countries.
Bangladesh has faced that test case with vigor and now stands as an example for many developing countries. Extreme poverty – defined as living below Purchasing Power Parity Rate Dollar 1.90 of consumption per day – declined from 44 % of the people in 1992 to 14 % of the people at present. Bangladesh’s human development achievements are now globally hailed. In some key indicators such as life expectancy, infant mortality, and maternal mortality, Bangladesh performs not only better than her regional neighbors but more like a middle-income country where average per capita income is almost three times higher than lower-middle-income Bangladesh. 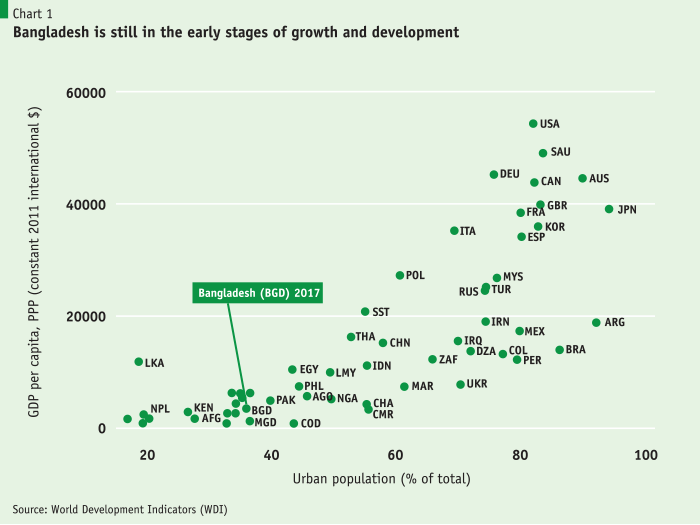
In recent decades, Bangladesh’s economic growth performance has been impressive too. The economy’s growth rate has steadily accelerated over the decades from 4 % p.a. in the 1980s to 6.6 %t p.a. in the 2010s. In the last three years, gross domestic product (GDP) growth rates have comfortably exceeded 7 % p.a. According to official estimates, growth has even crossed 8 % in the last two fiscal years. This performance puts Bangladesh among the fastest-growing economies globally.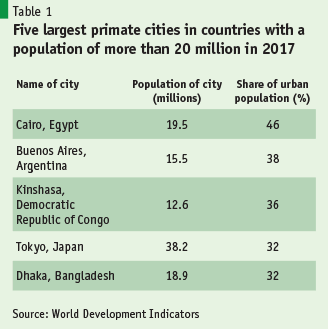
Further, as population growth rates have halved, accelerating growth has tripled real per-capita incomes since independence. According to World Bank’s estimates, in 2018, per-capita income measured by the international comparable Purchasing Power Parity Dollars stood at PPP$ 4,364 while in nominal dollars per capita income was US$1,736 or nine times what it was at independence. Bangladesh has been a lower-middle-income country under World Bank classification since 2015.
However, Bangladesh’s development is still in the early stages (Chart 1 below), and the critical challenge for Bangladesh will be to sustain this growth and even accelerate it to 10 % per annum to attain the target of becoming a developed country by 2041. Even sustaining the 7 to 8 % rates of growth will be quite a remarkable performance: it will require rapidly diversifying the economy to more products, services, and new trading partners.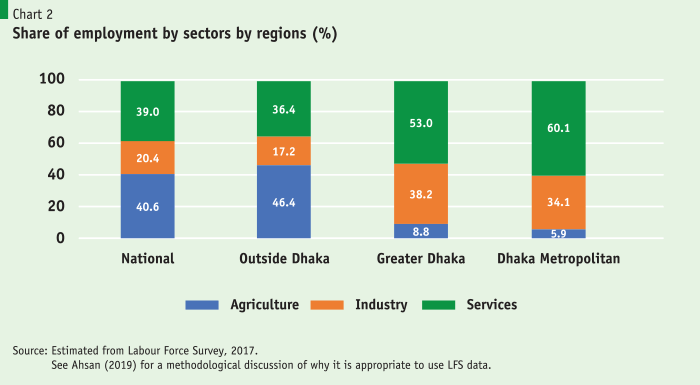
Developing robust, well-performing cities and towns will be a central challenge for sustaining growth in Bangladesh. Only well-functioning urban centers can provide the ecology for diversifying the economy and accelerating growth. Urban development has already been critical for achieving growth in Bangladesh’s manufacturing.
But this growth has been highly Dhaka-centric. The urban population of Bangladesh has grown by nearly ten times after independence, where as much as a third of which has taken place in Dhaka, whose population grew at an annual rate of 5.4 % p.a. between 1974 and 2017. Other large cities, though, i.e., Chittagong and Khulna with populations of more than one million, have grown at a far lower rate of 1.7 % p.a. Not only that, overall urban population growth has slowed down markedly in recent years from about 6.8 % p.a. in the first two decades to about 4.2 %since then, partly reflecting the slowdown in overall population growth. Further, the quality of urban growth defined in terms of providing good jobs also seems to have declined, as discussed in detail below. About half of the urban population lives in slums. These are disturbing developments, which, left unaddressed, will slow down future growth. 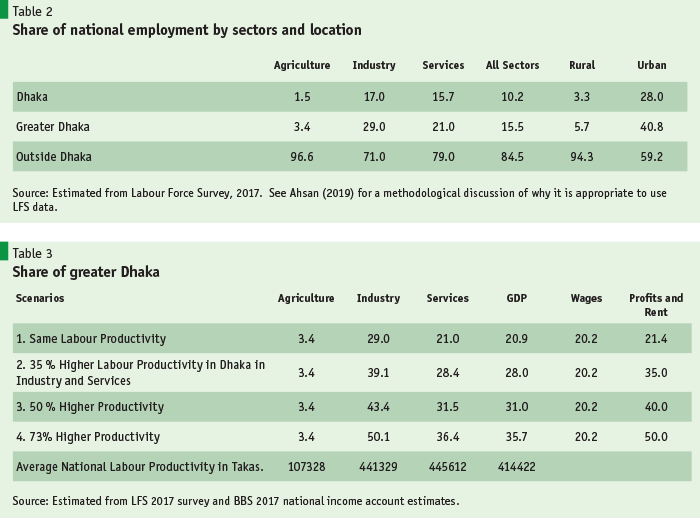
The urban population of Bangladesh has grown by nearly ten times after independence, where as much as a third of which has taken place in Dhaka, whose population grew at an annual rate of 5.4 % p.a. between 1974 and 2017.
The association between urban development and economic growth is one of the most robust relationships in economics. This relationship is self-evident from the diagram above that shows a scatterplot of the share of the urban population of 70 large-sized countries (with populations greater than 50 million) and their per capita incomes measured in PPP dollars for the year 2017. This smaller sample was chosen to reduce the clutter in the diagram. If we were to estimate this relationship using a larger data set of 93 countries (with populations more than 20 million), their growth from 1992 to 2017, and accounted for country fixed effects and time trends, we find robust relationship: a one percentage point increase in the share of urban population is associated with about 2.5% increase in per capita incomes. Thus, if Bangladesh were to raise its urban population share from 36% to 42%, its per capita income would show a rise by 15% according to these estimates. Such a linear calculation is provided here for illustrative purposes. As the diagram above makes clear – that the relationship between urban development and per capita incomes is not quadratic – urban development has more impact at higher levels of income. 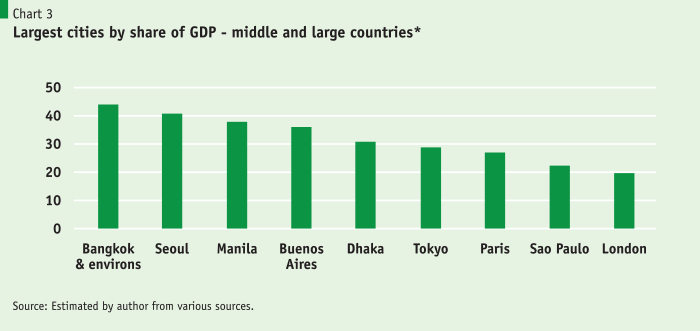
 This observation brings us to the main point of this paper: it is not only the growth of the urban population, cities, and towns that boosts incomes, the pattern and quality of urban development – as explained in the next paragraph – matter most of all. In the early stages of development urban development has significantly less impact than in later stages. In fact, in many African countries there has been rapid growth of urban population without any corresponding increase in growth.
This article, part of an ongoing research project on Bangladesh’s economic geography, suggests that an excessive concentration of economic activity in greater Dhaka is impeding overall urban development with significant adverse implications for long term growth. The analysis estimates the extent of the overgrowth of Dhaka of around 60% to 70 % in terms of population. Further, this overgrowth is adversely impacting overall urban development and its quality. By quality, we refer to the ability of urban areas to provide more productive and higher-wage jobs and thereby boost growth. We find that economic costs of Dhaka’s overgrowth are startlingly large: it lowers of GDP by over 10 % or about USD 32 billion annually.
The following section, briefly discusses the economics of city size and makes the point that the economy of Bangladesh is excessively Dhaka-centric and Dhaka is overgrown. The subsequent section shall then show how this excessive centralization is significantly and adversely affecting urban development in Bangladesh and overall growth prospects. This section also provides cost estimates of these impacts. Finally, the last section concludes by sketching out some policy approaches to addressing these issues.
The Size of Dhaka and Concentration of Economic Activity
The concentration of economic activity in cities is the result of efficient market forces, returns to scale, and agglomeration economies. Firms are drawn to large markets, transportation hubs, locations where labor, technology, and other intermediate inputs – and, not least, industry knowledge – are available. Once a clustering of industry and economic activities starts in cities, agglomeration economies such as returns to scale, externalities and network effects come into play to create further concentration and increase the size of the market in a cyclical way. These economic forces lead to the growth of cities and towns that host, by far, most of the economic activity in modern economies. Further, given Bangladesh’s compact geography and Dhaka’s central position, a high degree of concentration of economic activity is to be expected.
However, economic theory also suggests there are limits to concentration. There are optimum sizes for cities, beyond which the costs of diseconomies of scale, coordination problems, and negative externalities – such as the costs of congestion and pollution – outweigh the benefits of scale and agglomeration. The rising costs of immobile factors of production, such as land, water, or other factors whose supply is inelastic, raise costs prohibitively. Finally, there are natural geographic limits. All these factors work to limit city size. Ultimately, when the costs of these diseconomies and supply problems overcome economies of agglomeration, a city should stop growing.
Even so, because of market failures and political-economic interventions, cities often continue to grow beyond their optimal limits (Henderson et al., 2001). Urban development is an area where market and policy failures abound. Market failures — arising from lumpy investments, fixed costs and externalities, network effects, and circular cumulative causation distortions — are widespread. Due to these factors, there is an inherent bias in pure market forces to lead to the overgrowth of cities. Empirical research suggests that in practice, many cities are too large, where social marginal costs (congestion, commuting, environmental, coordination failures) exceed marginal social benefits (Henderson et al. 2001). Policy corrections to address these market failures thus becomes crucial. Finally, political economy plays its role in creating excessively large cities. The geographical location of the political elite can often bias economic decisions about the location of economic activity.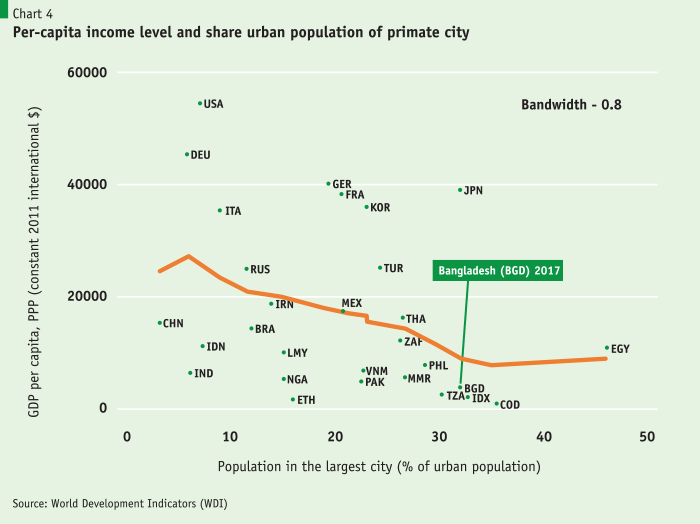
 There are signs that Dhaka’s size is now crossing these optimal limits of concentration. Traffic congestion in Dhaka alone was estimated to cost about 2.9 % of annual income (GDP) of Bangladesh in 2011 (Khan and Islam, 2013). Add to that, the health costs of dangerous levels of PM2.5 air pollution that reached 97.1 micrograms per cubic meter in 2018 and made Dhaka the second most polluted capital in the world after New Delhi. Further add the strain on groundwater and rivers, utility constraints, and other congestion costs. It seems intuitive that given these trends, i.e. the current growth in Dhaka is not sustainable.
Estimates of the Size and Overgrowth of Dhaka
What is the size of greater Dhaka and why do we think economic activity is excessively concentrated in Dhaka? Following international conventions, we will be using here the concept of greater Dhaka, i.e., which includes Metropolitan Dhaka, Gazipur, and Narayanganj. This usage follows the conventions used for measuring greater Tokyo, which includes the adjoining city of Yokohama, or metro-Manila and greater Bangkok. The first measure we use is the relative size of the cities, i.e. the share of urban population, of the most populous city compared to other cities in the country. The largest such city is defined as the primate city, and as we will see later in the next section, this concept has significant role in the analysis of the impact of urban development. By this definition, Dhaka is fifth largest primate city in the world after Cairo, Buenos Aires, Kinshasa, and Tokyo among countries with population greater than 20 million. Table 1 shows these cities ranked by their share of the urban population (column 3). While there are other cities such as Beijing, Shanghai, Delhi, Mumbai, São Paulo, that have larger populations than Dhaka, their share of urban populations in their countries are far lower, less than 10%.
The estimate of Dhaka’s share of the National Gross Domestic Product
The second measure is the share of total national economic activity or gross domestic product (GDP). Unfortunately, there are no recent official estimates of city or even district level GDP in Bangladesh. The last such estimate we have is for 1999 – 2000, where the share of greater Dhaka district’s GDP was 23.8% of the national GDP. That definition of Dhaka, however, is not comparable as it then included Manikganj, Munshiganj, and Narsinghdi. Most recently, a World Bank-led study has estimated Dhaka’s share of national GDP to be 20 % (Bird et al. 2018), which seems to be an extremely conservative estimate given that 15 % of all workers and almost 30 % of the industrial workers work in greater Dhaka. On the other side, are more casual estimates placing Dhaka’s share of GDP to be around 35 % of national GDP (e.g. Economist magazine, September 12, 2019, and statement by Chair of DCCI).
In this paper, we use labor force survey data to estimate the composition of economic activity in Dhaka and greater Dhaka in comparison to other districts in the country and then estimate GDP using labor productivity in different sectors. Here it is worth clarifying that we are now referring to not only urban areas but the entire districts of Dhaka, Gazipur, and Narayanganj. Given that these districts are highly urbanized, with more than 90 % of the labor force working in non-agricultural activities, this approach is not unreasonable.
Before we start this discussion, it is useful to briefly clarify a methodological point on using Labor Force Survey data at the district level. In another paper (Ahsan 2019) we have shown that employment data for the three main sectors and overall average wage data at the district level converge very closely to national estimates. Since we do not have to use weights to achieve this consistency, the district data on sectoral employment and overall wages, while not strictly representative, can be used with a reasonable level of confidence. In contrast, note, employment and wage data at the upazila level do not converge to national estimates and cannot be used.
As evident from Chart 2, greater Dhaka and Metropolitan Dhaka have disproportionately higher share of industrial and service sector jobs than the rest of the country: more than 90% of the jobs in the Dhaka region are in the industrial and service sectors. Outside Dhaka, however, the share of such jobs is just over half. Industrial jobs – manufacturing, utilities, and construction – are particularly concentrated in Dhaka.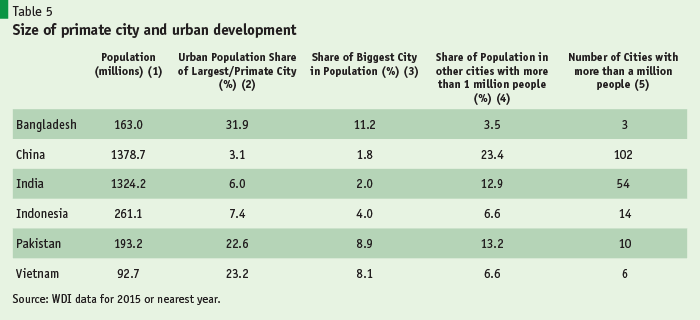
 The disproportionate share of industry and services jobs is confirmed again when we see in Table 2 that nearly 30 % of the industrial jobs and more than 20 % of service sector jobs in the country are in the capital region; this is disproportionate as this region has only 15% of jobs and 11% of the national population. Seen another way, more than 40 % of the urban jobs are in the Dhaka region. Correspondingly, only about 5 % of rural jobs are in the Dhaka region.
Now that we have data on the employment share of different sectors in both greater Dhaka and outside, this allows us to estimate labor productivity. We use data from the previous 2017 national income accounts for the three major sectors (agriculture, industry, services) and GDP and divided by the number of workers in the three main sectors by districts and national. to get an estimate of average labor productivity in the sectors that overall. The average labor productivity estimates are presented in the last row of table 3 below. The estimates that follow below are based on the following:
(1) GDP at factor cost = (GDPagr/Lagr) *Lagr + (GDPind/Lind) *Lind + (GDPser/Lser) *Lser
(2) GDP at factor cost = National Income = Total Wages + Profits & Rents =Average wage * Labour + Profits & Rent
Where GDP = Gross domestic product at producer prices, L = workers; agr= agriculture sector, ind=industrial sector, and ser=services sector. As we will be estimating from labor productivity, it is more appropriate to use producer prices as taxes cannot be attributed to districts.
To repeat, GDP data of the three major sectors at producer prices is obtained from the BBS for 2017. The labor force at both the national level and at the district level for the three different sectors is obtained from the Labour Force Survey of 2017. We are now ready to estimate the share of greater Dhaka in national GDP as well as in the three major sectors. We can also estimate the share of total wages of greater Dhaka using wage data from the labor force survey and employment. As national income is made up of wages, profits, and rents, an estimate of wages also allows us to get an estimate of profits and rents. The estimate of greater Dhaka’s share of national GDP now depends on our assumption of one of two things:
a. What is labor productivity in Dhaka in industry and services compared to the national average labor productivity in these two sectors? Or, alternatively,
b. What is the share of Dhaka in profits and rents in national income?
An assumption about labor productivity in Dhaka determines its share in profits and rents, and vice versa. Four scenarios are presented in table 3.
The first scenario assumes that labor productivity in the three sectors are same everywhere. That is, workers in industry and services working in greater Dhaka are not more productive than working in other smaller towns and rural areas. Even under this scenario, however, the share of actors Dhaka’s GDP at 21.4 % is greater than its share of employment, 15 %. This is directly because labour productivity in industry and services are more than four times higher than productivity in agriculture, and more than 90% of workers in greater Dhaka working industrial services whereas in the rest of the country just over 50% of the workers work in these sectors.
This scenario of equal productivity of Dhaka and the rest of the country is intuitively unrealistic. This scenario is also rejected by wage data which shows that wages in greater Dhaka are higher than the national average by about 30% for greater Dhaka and 40 % for metropolitan Dhaka. As wages and labor productivity are closely related, one can safely assume labor productivity in industry and services will be significantly higher in Dhaka – more than the average 30 % premium in wage as we need to account for profits and rents which also come from.
This brings us to scenarios two and three, where we assume that labour productivity is higher in the industry and services sector in Dhaka then the national average by 35% or by 50%. These are reasonable assumptions given that most of the large-scale industry, ready-made garments, and high-end services in finance, communications, health and education, and the public sector are in Dhaka. Under these two scenarios, greater Dhaka share of national GDP comes out as 28% and 31% respectively. In these two scenarios, the share of Dhaka in national profits and rents are estimated at 35% and 40% respectively. Overall, it seems that scenarios two and three represent plausible if conservative estimates.
Scenario four turns the exercise around and asks how plausible is the popularly held view that the share of Dhaka in national GDP is about 35 % (The Economist Magazine, DCCI Chair’s statement). It turns out that such a share would imply that labor productivity in industry and services in Dhaka would have to be more than 70% higher than the national average and that Dhaka’s share of profits and rents would be 50%. While these are not completely implausible numbers, it is likely these estimates are probably an upper bound for any estimate of Dhaka’s GDP.
The reasonable conclusion at this point would be scenarios two or three: that is to work with a Dhaka’s GDP size of about 28 to 31 % of the national GDP. What does this size signify? It signifies that not only by population, but the economy of Bangladesh is one of the most concentrated in the world. This is presented in Chart 3.
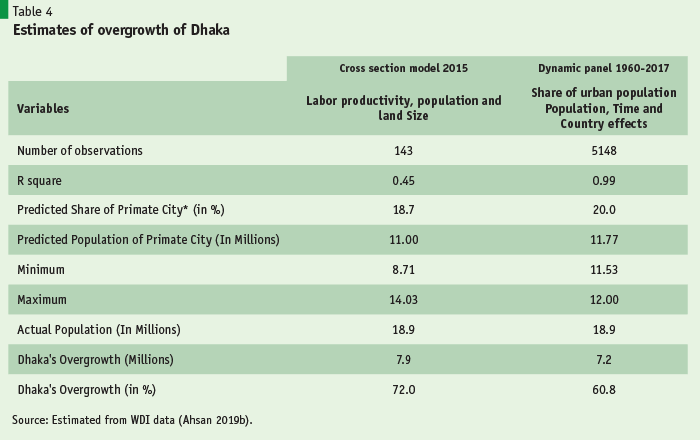
The next question is, how much is Dhaka overgrown? Unfortunately, we cannot answer this question using GDP data for cities. This data is highly patchy and mostly unavailable for developing countries. However, we can use the available data on urban population and the share of the primate city population share. We use the following two equations to estimate the overgrowth of Dhaka by first estimating the expected share of greater Dhaka’s population:
(3) Log of Share or Urban Population in Primate City (i.e., greater Dhaka) = depends on (log average national labour productivity, population, and land area). This estimate is based on cross-section data of 143 countries and regions in 2015.
(4) Log of Share or Urban Population in Primate City (i.e., greater Dhaka) = depends on (log (average national labour productivity, share of urban population, population, with country and time fixed effects). This estimate is based on a Panel of 93 middle to large-sized countries with populations over 20 million.
The results are presented below in Table 4. According to two different models, greater Dhaka’s actual share of urban population is 61 to 72 % greater than what would be predicted by two models: i.e., greater Dhaka’s population would be 7.2 million to 7.9 million less than what it is now according to global norms. We will be conservative in this article and take the lower number as our estimate from here onwards. Aside from being conservative, the lower, more conservative estimate has higher claim to reliability as it has accounted for country and time effects, thereby ruling out many time-invariant or place-invariant factors. Not surprisingly, the explanatory power of the lower estimate, as shown by the R square number, is significantly higher than that of the first estimate. To reiterate, we will use our estimates that show that Dhaka is overgrown by 61 % than what international norms would predict.
What does the economic impact of Dhaka’s overgrowth? We take up this question in the next section.
Excessive growth in Dhaka is leading to slower urban development
The internal costs of Dhaka’s overgrowth and congestion – i.e., costs within greater Dhaka – have been quite well researched. In the last ten years, the increase in traffic congestion in Dhaka has decreased the average traffic speed in Dhaka from 21 km/hour to less than 6.4 km/hour (World Bank, 2017). Traffic congestion in Dhaka eats up 3.2 million working hours per day and, altogether, it costs an estimated 2.9 % of GDP per annum (Khan and Islam, 2013). In some ways, movement around the city has become so prohibitively time consuming that Dhaka is not entirely functional as a city of dense, interconnected people working together. Add to this, the air pollution eight times higher than WHO safety guidelines, water-logging and sanitation-related health costs include vector-borne diseases such as dengue, the negative externalities of Dhaka city’s growth are likely overcoming the returns from growth and agglomeration. However, because of market and policy failures discussed earlier, the pressure is to keep Dhaka growing.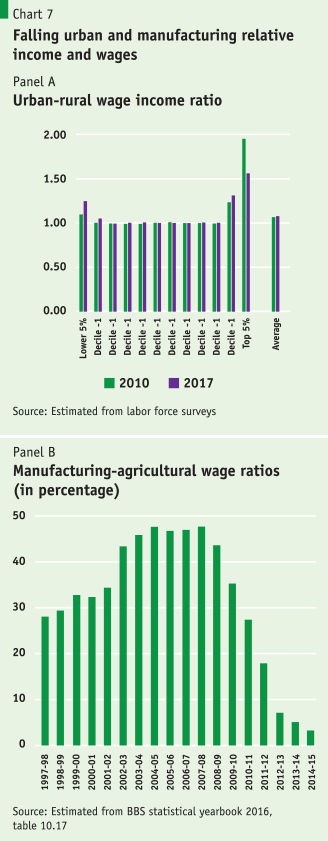
In this article, we ignore the internal costs of Dhaka’s growth. Instead, we suggest two sets of evidence to suggest why Dhaka’s excessive growth is associated with an adverse impact on overall growth and urban development. In the first case, we will use the concept of a primate city – i.e., the city with the largest share of the urban population – and its relationship with overall urban development and economic growth. Second, we will draw on both household income and expenditure and the labor force surveys to show how urban and rural income, poverty, and wage differential have narrowed significantly in the past decade. We will suggest that these are both a sign of rural dynamism and a sign of urban malaise. Finally, we will come up with an estimate of the costs of excessive growth in Dhaka.
Urban development, economic growth, and the role of the primate city
One of the most robust associations in economic growth is between urban development and per capita income levels, as illustrated in Chart 1. If we take the panel data available for middle to large 93 countries with population more than 20 million, between 1960 and 2007, and control for country fixed effects, the relationship suggests that for each one percentage point increase in the share of the urban population (e.g. if Bangladesh’s urban population share rose from 35.8 to 36.8 %), purchasing power parity dollars based per capita income is 2.5 % higher.
However, there are significant complications in this relationship as pointed out by Henderson (2003). As noted earlier, the relationship is non-linear, and there is a bi-causal relationship between the two. Moreover, the critical variable here is the primate city: the population of the largest city. While overall urban growth is associated with high levels of income, that is not the case with excessive growth and concentration in the primate city – i.e. the largest city. Even a casual look at the data (Chart 4) suggests that if the share of the primate city is more than say between 20 to 24 % of the urban population, per capita income levels decline steadily.
Interestingly, this appears to happen because an excessive growth of the primate city lowers overall urban development. Chart 4 (above) and 5 (below) show that this may be the case in Bangladesh. Chart 4 shows that countries where the size of the primate city becomes excessively large (more than 23-24 %) have lower per-capita income levels on average. The most extreme example here is Egypt and a prominent exception here is Japan, where despite the large size of Tokyo per capita income levels are much higher. The Tokyo exception may not be too surprising given that Tokyo-Yokohama is a port city in addition to being the political and commercial capital. Bangladesh, however, falls close to the curve with a primate city population share of around 32 % of the urban population.
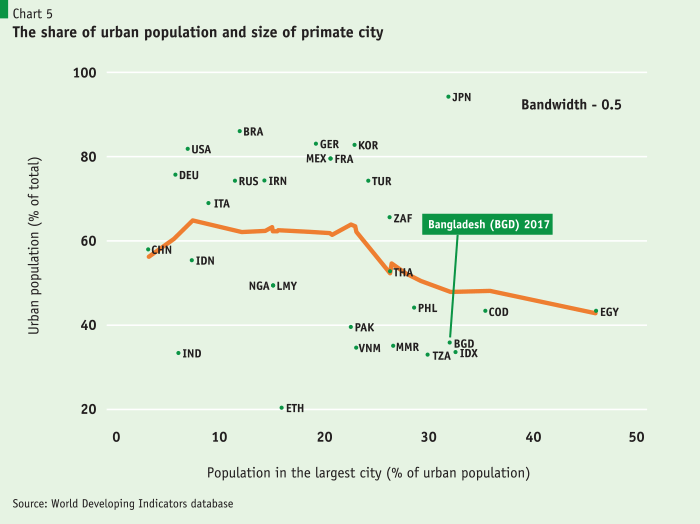
Chart 5, below, presents one of the main channels through which the size of the primate city size affects per capita income level and growth. The graph suggests that the excessive growth of the primate city lowers overall urban development and its quality. This distortionary effect probably takes place because the primate city draws public and private resources away from other cities, creating misallocation of resources and a lowering of productivity. Once again, Bangladesh, with a primate city having a 32 % share, ends up with a lower share of the urban population, which in turn is associated with lower per capita income levels.
The inverse relationship between the size of the primate city and overall urban development is confirmed by statistical testing. Once again, controlling for country fixed effects and time fixed effects for 93 countries with population of more than 20 million, the inverse relationship between the primate city and urban development is significant and tight: controlling for population, urbanization and per-capita income or labor productivity, a 1 percentage point increase in the primate city’s share of urban population (i.e., say from 32.1 % to 33.1 % in the case of Bangladesh) is associated with a 1.1 % decline in the share of urban population with a good fit of R square more than 0.6 (Ahsan 2019b).
The next piece of, albeit indicative, evidence about the excessive growth of Bangladesh’s primate city and its adverse impact on overall urban development and growth of other cities is presented in table 5. The table suggests that while Bangladesh has the largest primate city share in this group, this has been accompanied by relatively less urban development outside this primate city. Thus, there are only three cities in Bangladesh (greater Dhaka, Chittagong, and Khulna) with a population of more than 1 million people (Column 5). In comparison there are 10 such cities in Pakistan, 14 in Indonesia, 54 in India, and 102 in China. Similarly, the share of population living in more than a million plus size cities other than the largest/primate city shown in Column (4) – another indicator of broader urban development – is only 3.5 % in Bangladesh, far less than the other countries.
Narrowing urban and rural income, consumption and wages
The second piece of indirect evidence supporting the picture of a stymied urban development comes from looking at income and wage trends from households and national wage trends estimated by the BBS (Charts 6 and 7 below). Economic development happens through structural change under which workers and resources move out of less productive agriculture and the rural economy to more productive manufacturing and service jobs that are in urban areas. In this process, higher incomes and higher wages in urban areas draw workers out of rural areas to work in more productive urban and manufacturing jobs. In a robust development process, such a structural transformation mechanism will work for a long time as the country climbs into the upper middle-income status. At such a point, enough workers will have moved into urban areas, the rural areas will have also become more productive, and urban-rural wages in real terms should converge.
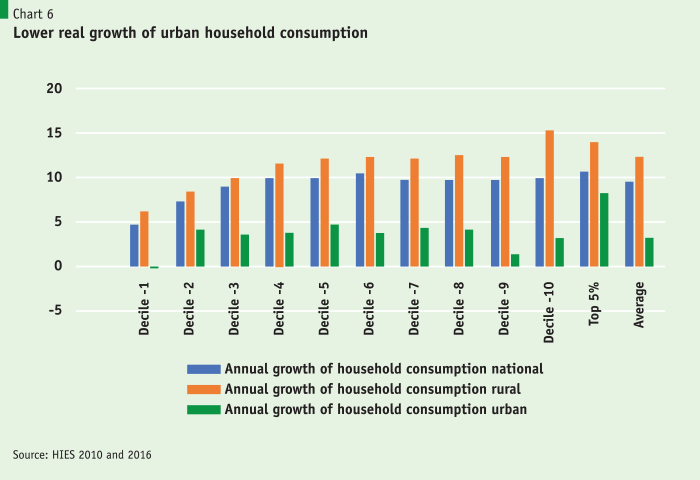
In Bangladesh in the last decade, this transformation process appears to have been significantly weakened (Charts 6 and 7 below). We see this below in the difference between robust increases in rural household consumption and the comparatively more moderate increase in urban consumption.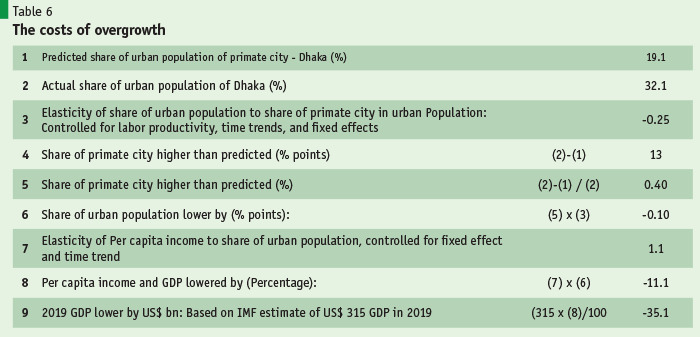
Thus, the rural economy seems to show more dynamism contrary to expectations. Looking at income and wages in Chart 6 also confirms this trend: the urban-rural income premium or the manufacturing-agricultural wage premia have become extremely narrow. The urban-rural wage differentials have narrowed from 12 % urban premia in 2010 to 8 % premia in 2017 on average. Internationally, the average nominal wage premia in urban areas in 110 countries were 38 % (Artza et al., 2016).
On the assumption that most manufacturing jobs are in urban areas while agricultural jobs are, by definition, located in the rural areas, the relative manufacturing agricultural wage premia provide a check on the labor force survey data cited earlier. Here too, in Chart 5, the evidence of collapsing manufacturing and urban wage premium is striking.
Could it be the case that the narrowing urban wage differential represents rural economic dynamism is also catching up with a dynamic urban economy? Unfortunately, two related pieces of evidence suggest otherwise. Chart 6 above has shown that urban consumption growth has been relatively anemic. A look at poverty complements this finding. Consistent with the trends that we have seen in consumption and wage growth, we find that while poverty rates in rural areas declined dramatically, poverty rates in urban areas have declined far less in recent years. While extreme poverty rates in rural areas declined from 21.1 % in 2010 to 14.9 % in 2016, extreme urban poverty rates stood at virtually the same point, 7.6 % in 2016 compared to 7.7 % in 2010 (BBS 2017). Thus, 90 % of extreme poverty reduction between 2010 and 2016 took place in rural areas.
The costs of Dhaka’s overgrowth
So far, this article has made two points. First, that Dhaka has grown excessively in terms of population by more than 60% over what would be predicted by international norms. Second, Dhaka’s excessive growth is associated with slower urban development and, also, to a lesser quality urban development in terms of providing incomes and good jobs. The next task is to see how we can quantify the relationship between Dhaka’s growth and its impact on incomes.
…Dhaka has grown excessively in terms of population by more than 60% over what would be predicted by international norms. Second, Dhaka’s excessive growth is associated with slower urban development and, also, to a lesser quality urban development in terms of providing incomes and good jobs.
We use the insights from Charts 1, 4, and 5 and Table 4 above to make this estimate. These charts showed how per-capita incomes and the share of the urban population were closely related. On the other hand, an increase in the primate city’s share of the urban population was associated with a lowering of the share of the urban population. Using these insights, using our panel data on 93 countries with population more 20 million and 26 years of data we estimate two elasticities presented in rows 3 and 7 below. We define them as:
Row 3: Percentage change of share of the urban population in total population/ Percentage change in share of primate city’s population in total urban population.
Row 7: Percentage change per capita incomes measured in 2011 PPP dollars/ Percentage change in share of the urban population in total population.
Before turning to the results, it is worth clarifying the methodology a little more. The estimated parameters are based on a panel of medium to large-sized 93 countries with population of more than 20 million and using 26 years of data. As a result of using the panel and controlling for country and time trends, we have been able to avoid many of the risks of spurious correlation between the variables and have tended to err on the conservative side. Thus, for instant, if we had not used time trends, both the elasticity estimates would have been significantly higher. That would have led to a significantly higher estimate of income loss. Nonetheless, these estimates above need to be treated cautiously, as exploratory estimates.
In the event, the results presented above are startlingly large. In 2017, per capita income and GDP were lower by 11.1 % than its potential due to the adverse impact of Dhaka’s size on overall urban development. Assuming this effect holds today, the GDP loss in 2019 would be about US$ 35 billion. It is worth stressing again: this estimate is the impact of constrained overall urban development. The other direct costs of Dhaka’s growth, such as traffic congestion costs (estimated at2.9 % of GDP in 2011), and environmental costs, and health costs arising from environmental degradation have not been included here.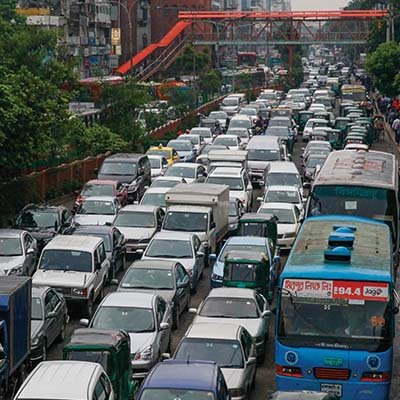
Conclusion
This article’s main point has been that by international standards, and given Bangladesh’s stage of development, Bangladesh’s economic activity and urban population are excessively concentrated in Dhaka. The tripling of agriculture production and healthy inflows of workers’ remittances have contributed importantly to growth, but most economic growth has come from higher productivity manufacturing and services sector in cities and towns; such a pattern only follows international, historical experience.
Bangladesh’s economic activity and urban population are excessively concentrated in Dhaka. The tripling of agriculture production and healthy inflows of workers’ remittances have contributed importantly to growth, but most economic growth has come from higher productivity manufacturing and services sector in cities and towns…
However, in Bangladesh’s case, this growth has been extremely Dhaka-centric. As shown above, Dhaka’s share of national GDP is among the highest in the developing world. Then, Dhaka’s share of the urban population is significantly higher than what would be predicted by international norms. International data suggest that this concentration of economic and urban population in Dhaka has likely crossed optimal limits and is now adversely affecting overall national urban development both in terms of size and in terms of quality. On the one hand, Dhaka has become highly congested and somewhat dysfunctional. On the other hand, both public and private resources, including human capital, are being over-allocated to Dhaka. The skewed allocation is neglecting the development of other major cities such as Chittagong, Khulna, and Rajshahi, where growth has been relatively less.
Thus, overall, the current pattern of urban development is not creating productive jobs adequately. As a result, urban wages (relative to rural wages) are lower than they should be by international standards. Consistently, urban poverty – relative to rural poverty – is significantly higher. Further, this also means that the adverse impact on overall urban development is lowering overall economic activity and per capita incomes. We estimate that per-capita incomes and GDP are lower by about 11 % as a result. Further, if this excessive concentration in Dhaka is not addressed, economic growth is unlikely to be sustainable in the future.
Although this article is not about policy responses, we can say a few preliminary things about policy? As noted earlier, this paper is part of a larger ongoing research project where policy issues are being taken up in more detail. Let us make a few points drawing on that work.
It is, first, worth stressing that the findings do not imply that public investment in Dhaka should be reduced. Dhaka will continue to grow for a while at least because of sheer momentum, and thus its efficient development will be critical. In this respect, the Purbachal/East Dhaka development project is an important initiative assuming it addresses environmental concerns adequately. However, Dhaka’s growth, relative to other cities and towns, needs to slow down, and growth in other cities and towns accelerate.
The big policy challenge will be the need to rehaul the urban development strategy to make it much more urban planning based and spatially evenly distributed: i.e. specifically by providing more technical capacity and investment for the growth of cities other than Dhaka and thereby promote urban development more broadly.
Research suggests that at least some place-based policy issues are tractable. For instance, connectivity and transport corridors between other cities and regions and telecommunications and services that will attract private investment will help a more spatially balanced development to take place (e.g., Henderson et al. 2001, Lall 2006). Our research also suggests that within Bangladesh’s districts, infrastructure development – power, roads, and storage in particular – helps promote economic density and create more productive manufacturing and service jobs (Ahsan 2019). Here an unfinished agenda is to develop effective targeting rules to direct resources to avoid costly mistakes of place-based policies.
However, proper planning and investment will not be enough. There must be “De-concentration,” decentralization, and devolution. “Deconcentration” of government agencies, i.e. locating them out of Dhaka can be a good starting point, provided decision-making authority has been granted to those devolved agencies. Complementary to this approach, providing quality services in health and education will also be necessary for attracting human capital to other towns and cities.
However, we will need to go deeper. Urban planning and management are inherently local knowledge and local ownership intensive and requires effective coordination. It will not be possible for the 35 development-related Ministries headquartered and sitting in Dhaka to provide this coordination for the 340 city and municipal corporations. Hence, economic, administrative, and political powers will need to be devolved to city and town governments. That will mean providing them with technical capacity, tax bases and expenditure authority in a significant way. It is not a coincidence that in recent decades the most successful urbanization has taken plan in the dynamic East Asian economies that are among the most decentralized in the developing world.
References
Ahsan, A. (2019a) “Bangladesh’s Economic Geography: Some Patterns and Issues”, Paper presented at Bangladesh Development Initiative Conference, March 2019, Yale School of Management, New Haven. Paper now being revised for submission to Bangladesh Development Studies.
Ahsan, A.(2019b) “Econometric Estimates of Primate City, Urban Development, and Per-capita Income Relationships Using International Panel Data,” mimeo.
Ahsan, A. (2018) “Can Bangladesh Develop Without Decentralizing: Some Lessons from East Asia”. Policy Insights, PRI Quarterly, October 2018
Bird, Julia, Yue Li, Hossain Z. Rahman, Martin Rama, Anthony J. Venables (2018) Toward Great Dhaka: A New Urban Development Paradigm Eastwards, World Bank
Daily Star Business Report (2017) “Dhaka’s Economic Activities Unplanned”, February 24, 2017
Economist (2019), “Bangladesh Tries to Muffle the Siren Song of Dhaka,” September 12, 2019
Khan, Tanzila and Mohammad R. Islam (2013) “Estimating Costs of Traffic Congestion in Dhaka City”, International Journal of Engineering Science and Innovative Technology,
Artza, Georgeanne M., Mainul Hoqueb, Peter F. Orazema, Urja Shah (2016), “Urban-Rural Wage Gaps, Inefficient Labor Allocations, and GDP per Capita”, Economics Working Papers: 16006, University of Iowa.
Bangladesh Bureau of Statistics (2017a), Household Income Expenditure Survey 2016/2017
Bangladesh Bureau of Statistics (2017b), Statistical Yearbook 2016
Bangladesh Bureau of Statistics (2013), District Statistics Series 2011
Henderson, J. Vernon (2003) “The Urbanization Process and Economic Growth: The So-What Question” Journal of Economic Growth, Vol. 8, issue 1, 47-71
Henderson, J. Vernon, Z. Shalizi, and Anthony J. Venables (2001) “Geography and Development,” Journal of Economic Geography, I, pp. 81-105
Krugman, Paul R. (1991), “Increasing Returns and Economic Geography” Journal of Political Economy, V. 99, p. 483-499
Lall, Somik V. (2006), “Infrastructure and Regional Growth, Growth Dynamics, and Policy Relevance for India,” Annals of Regional Science, Springer-Verlag
World Bank (2017), “Dhaka Urban Upgrading Project,” Project Information Document/Integrated Safeguards Data Sheet.
Notes:
- The reason for using a population of 20 million as a cutoff is for smaller countries, the primate city will be inherently large. Very small countries such as Luxemburg or Singapore can only have one city. More broadly the average share of urban population for primate cities in smaller countries (less than 20 million population) is 42 %, while it is 27.5 % for middle-sized countries of population between 20 and 50 million, and 20.2 % in large countries with population over 50 million.